Advertiser Disclosure
Shocking Student Loan Debt Statistics: $1.7 Trillion of Student Loans in 2022
Updated On September 10, 2022
Editorial Note: This content is based solely on the author's opinions and is not provided, approved, endorsed or reviewed by any financial institution or partner.

The latest student loan debt statistics for 2022 have reached epic proportions. Student loan debt is now the second highest consumer debt category – behind only mortgage debt – and higher than both credit cards and auto loans.
According to Mentor, there are more than 45 million borrowers who collectively owe $1.7 trillion in student loan debt in the U.S. alone.
Here are the latest student loan debt statistics for graduate school student loan debt:
- Dental School: $260,000
- Medical School: $180,000
- Pharmacy School: $160,000
- Veterinary School: $140,000
- Law School: $140,000
The latest student loan debt statistics for 2020 show how serious the student loan debt crisis has become – for borrowers across all demographics and age groups.If you are a student loan borrower, the following student loan debt statistics can help you make more informed decisions regarding student loan refinance, student loan consolidation, student loan repayment and student loan forgiveness.
Student Loan Statistics: Overview
Total Student Loan Debt: $1.56 trillion
Total U.S. Borrowers With Student Loan Debt: 44.2 million
Student Loan Delinquency Or Default Rate: 10.7% (90+ days delinquent)
Total Increase In Student Loan Debt In Most Recent Quarter: $29 billion
New Delinquent Balances (30+ days): $32.6 billion
New Delinquent Balances – Seriously Delinquent (90+ days): $31 billion
(Source: As of 1Q 2018, Federal Reserve & New York Federal Reserve)
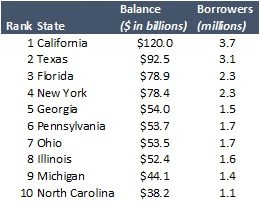
States With The Most Student Loan Debt
Not surprisingly, states with larger populations have higher aggregate student loan debt. California, Florida, Texas and New York are among the four highest states for total student loan debt outstanding among resident borrowers.
California, Florida, Texas and New York represent more than 20% of all U.S. student loan borrowers.
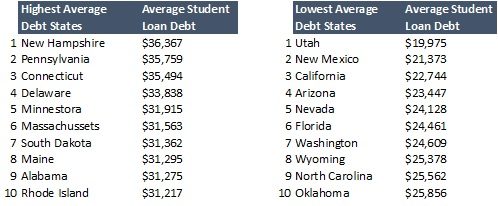
High Student Loan Debt States & Low Student Loan Debt States
New Hampshire has the highest average student loan debt per student ($36,367) from the Class of 2016.
Utah has the lowest average student loan debt per student ($19,975) from the Class of 2016.
Student Loan Debt Per Capita In Select U.S. States
In the U.S., as of 2016, the average student loan debt per capita is $4,920. Pennsylvania, New York and Michigan have among the highest student loan debt per capita in the nation.
Arizona: $4,760
California: $4,160
Florida: $4,480
Michigan: $5,330
New York: $5,570
Ohio: $5,700
Pennsylvania: $5,690
Texas: $4,510
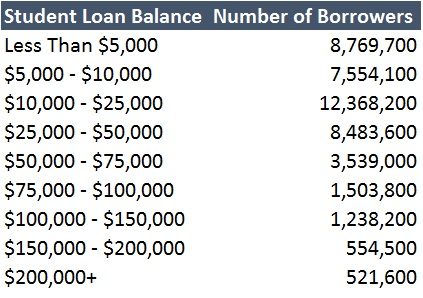
Distribution Of Student Loan Borrowers By Balance
As of 2018, more than 42 million student loan borrowers have student loan debt of $100,000 or less.
More than 2 million student loan borrowers have student loan debt greater than $100,000, with 415,000 of that total holding student loan debt greater than $200,000.
The largest concentration of student loan debt is $10,000 – $25,000, which accounts for 12.4 million student loan borrowers.
Total Student Loan Balances By Age Group
Over the past five years, student loan debt balances have grown across each age category.
On a percentage basis, the largest increase in student loan debt has come from a surprising age group: 60 to 69-year-olds, who have experienced an 71.5% increase in student loan debt. However, on a dollar basis, this age group represents a $35.6 billion increase over the same period, which is the lowest increase among all age groups.
On a dollar basis, the highest increase in student loan debt is among 30 to 39-year-olds, who as a group now hold over $461 billion in student loans. On a percentage basis, the amount of student loan debt held by 30-39 year-olds has increased 30.2% over the past five years.
Number Of Student Loan Borrowers By Age Group
The largest concentration of student loan borrowers is under 30-years-old, followed by the 30-39 age group.
Therefore, there are 29.1 million student loan borrowers under the age of 39, with this group representing approximately 65% of all student loan borrowers.
As of 2017, here is the breakdown of student loan borrowers by age.
< 30-years-old: 16.8 million
30-39: 12.3 million
40-49: 7.3 million
50-59: 5.2 million
60+: 3.2 million
Student Loan Debt Outstanding By Student Loan Program
Over 33 million student loan borrowers hold approximately $1.1 billion in Direct Loans. Another 14.5 million student loan borrowers hold $301 billion in Federal Family Education Loans (FFEL).
Direct Loans: $1,066.8 billion (33.3 million borrowers)
Federal Family Education Loans (FFEL): $301.1 billion (14.5 million borrowers)
Perkins Loans: $7.6 billion (2.5 million borrowers)
TOTAL: $1,375.5 billion
Student Loan Debt Outstanding By Student Loan Type
Stafford Subsidized: $272.2 billion (29.6 million borrowers)
Stafford Unsubsidized: $463.3 billion (28.4 million borrowers)
Stafford Combined: $735.5 billion (33.0 million unique borrowers)
Grad PLUS: $59.6 billion (1.2 million borrowers)
Parent PLUS: $83.7 billion (3.5 million borrowers)
Perkins: $7.6 billion (2.5 million borrowers)
Consolidation: $489.0 billion (12.0 million borrowers)
Student Loan Debt Statistics By Loan Status For Direct Loans
Approximately $600 billion in Direct Loans across 17.8 million student loan borrowers are in student loan repayment. Approximately 11 million student loan borrowers are in student loan deferment, student loan forbearance or student loan default.
Student Loans In School: $133.5 billion (7.4 million borrowers)
Student Loans In Repayment: $600.0 billion (17.8 million borrowers)
Student Loans In Deferment: $103.0 billion (3.3 million borrowers)
Student Loans in Forbearance: $108.3 billion borrowers (2.6 million borrowers)
Student Loans In Default: $88.4 billion (4.7 million borrowers)
Student Loans In Grace Period: $25.9 billion borrowers (1.2 million borrowers)
Student Loan Debt Statistics By Repayment Plan For Direct Loans
There are 12.8 million borrowers with $233.5 billion of student loan debt in the Level Student Loan Repayment Plan (student loan repayment in 10 years or less), which represents the largest concentration of borrowers in student loan repayment.
The second most concentrated group of borrowers is enrolled in Income-Based Repayment (IBR) at $192.0 billion and 3.6 million borrowers.
Level Repayment Plan (< 10 years): $233.5 billion (12.8 million borrowers)
Level Repayment Plan (> 10 years): $79.1 billion (1.8 million borrowers)
Graduated Repayment Plan (< 10 years): $88.3 billion (3.3 million borrowers)
Graduated Repayment Plan (> 10 years): $14.3 billion (0.3 million borrowers)
Income-Contingent Repayment (ICR) Plan: $27.6 billion (0.6 million borrowers)
Income-Based Repayment (IBR) Plan: $192.0 billion (3.6 million borrowers)
Pay As You Earn (PAYE) Plan: $68.3 billion (1.2 million borrowers)
Revised Pay As You Earn (REPAYE) Plan: $108.8 billion (2.0 million borrowers)
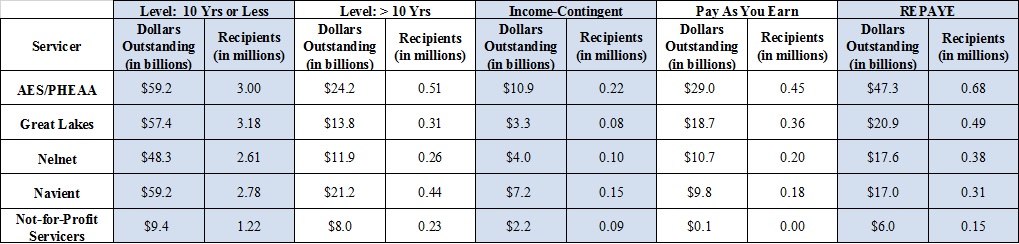
Servicer Portfolio By Repayment Plan
As of December 31, 2017, AES/PHEAA (otherwise known as FedLoan Servicing) and Navient service the largest portfolios of student loans in repayment in the U.S. FedLoan Servicing is the largest servicer of federal direct and Federal Family Education Loans.
The most popular student loan repayment plan is the Level Repayment Plan, which means student loan repayment in less than 10 years, followed by REPAYE (Revised Pay As You Earn).
Other Important Student Loan Debt Statistics
In addition, there are several other startling statistics regarding the state of student loan debt:
- Nearly seven in 10 seniors (68%) who graduated from public and non-profit colleges in 2015 had student loan debt.
- In 2012, 1.3 million students graduated with student loan debt.
- In 2012, 66% graduated from public colleges, 75% graduated from private colleges and 88% graduated from for-profit colleges.
- Almost half (47%) of private loan borrowers in 2011-12 borrowed less than they could have in federal Stafford loans for college.
- While private loan volume peaked at $18.1 billion in 2007-2008, private loan volume is now $7.8 billion as of 2014-2015.
- 6% of all undergraduates – 1,373,000 students – borrowed private loans in 2011-12.
- Four out of five 2016 graduates with state loan debt attended schools in just four states: Texas, Minnesota, Massachusetts, andNew Jersey that awarded only 14% of bachelor’s degrees.
- Of the 100 colleges where graduates borrow most in private loans, 85 are nonprofit four-year colleges and 34 are located in Pennsylvania.
- At public colleges, average debt in 2012 was $25,550 (25% higher than in 2008, when the average was $20,450).
- At private nonprofit colleges, average debt in 2012 was $32,300 (15% higher than in 2008, when the average was $28,200).
- At for-profit colleges, average debt in 2012 was $39,950 (26% higher than in 2008, when the average was $31,800).
- About 20% of the Class of 2012’s student loans were private student loans.
- Graduates who receive Pell Grants are more likely to borrow more debt: 88% had student loans in 2012, with an average of $31,200 per borrower.
- Graduates who did not receive Pell Grants: 53% of those who never received a Pell Grant had debt, with an average of $26,450 per borrower — $4,750 less than the average debt for Pell recipients with debt.
(Source: The Institute for College Access and Success)
Student Loan Forgiveness
Student loan forgiveness comes in several forms. Two of the most popular types of student loan forgiveness are Public Service Loan Forgiveness and Teacher Student Loan Forgiveness.
As of December 31, 2017, there are 802,040 cumulative Public Service Loan Forgiveness borrowers.
Since 2012, 1,361,184 employment certification forms have been approved and 705,362 have been denied.
About 140,000 of student loan borrowers have applied for student loan forgiveness under the borrower defense to repaying rule since 2015.
(The above student loan debt statistics include data from The New York Federal Reserve Credit Panel/Equifax, The Institute For College Access and Success, National Student Loan Data System, Mark Kantrowitz, Federal Student Aid and FedLoan Servicing).For press inquiries regarding these student loan debt statistics, please contact us.